Last Updated on 01/26/2015 by Chris Gampat
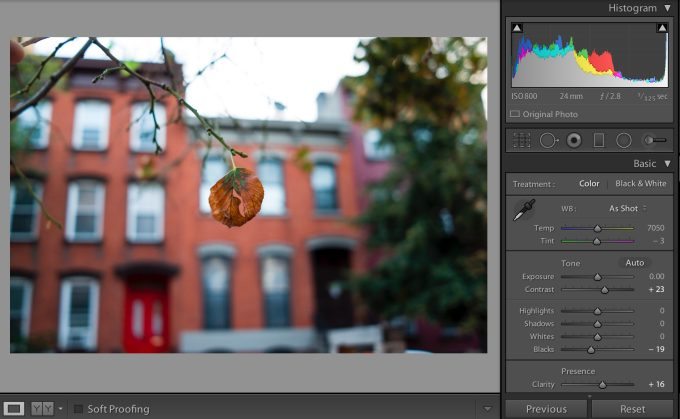
The histogram is a readout of information that tells you things that you won’t necessarily see in the image that you shoot. If you know anything about a tonal curve, it’s kind of similar. The histogram displays data on the highlights, midtones, and shadows but also displays it for colors.
The folks at Phlearn created a video explaining the histogram in 18 minutes, and pack a wealth of educational stuff that you can use to help you create the images that you want. It’s important to know that while many cameras can shoot the same exposure, they don’t always capture the same amount of information in the scene. For example, some sensors capture more information in the color depth, while others have a larger dynamic range.
But this doesn’t just go for digital. In the film days, negative film had more versatility but chrome film had better colors.
The video on how to read the histogram is after the jump.


